Check out our White Paper Series!
A complete library of helpful advice and survival guides for every aspect of system monitoring and control.
1-800-693-0351
Have a specific question? Ask our team of expert engineers and get a specific answer!
Sign up for the next DPS Factory Training!
Whether you're new to our equipment or you've used it for years, DPS factory training is the best way to get more from your monitoring.
Reserve Your Seat TodayT/Mon's customizable displays present network events in plain English and geographic maps, in terms that your staff will immediately understand and take action on. The T/Mon interface is easy to use and ensures that system operators will have the right information to take corrective action in an emergency.
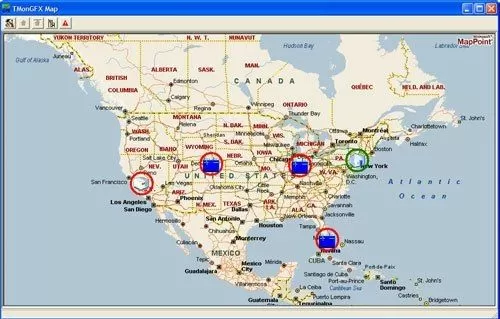
T/Mon GFX combines the power of T/Mon with an intuitive MapPoint interface. With T/Mon GFX, any PC anywhere on your network can become a complete T/Mon monitoring station, with the full power of monitoring and acknowledging alarms, operating control relays, and generating reports for in-depth analysis of network events.
 |  |
|---|---|
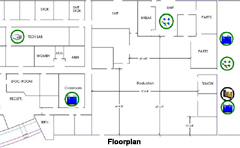
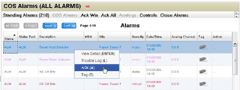
| Floorplan View - T/Mon GFX: You'll upload your own backgrounds and maps in T/Mon GFX to customize the way you view alarms. This example shows a drawing of a floorplan, with alarm icons associated to specific rooms within the building for a drilled-down view. | Change of State - Immediate Notification of New Events: The COS screen displays alarm points that have changed from Normal to Alarm, or vice versa. You don't have to hunt to find out what has changed in your network - the COS screen lists it for you. Here you can also acknowledge alarms. |
 |  |
| Standing Alarms - All Current Alarms: The Standing Alarm list is continually updated to show all currently failed alarms. | Labeled Controls - Easy Control of Remote Site Devices: The Labeled Controls screen gives access to devices at specific remote sites. Just highlight the control and select. |
 |  |
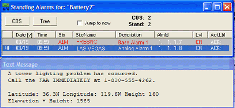
| Text Messages - Give Specific Instructions to NOC Staff: The COS and Standing Alarm screens feature Text Messages that give specific instructions for correcting specific alarms. Everyone on your NOC staff, even without extra training, will know precisely what to do and who to call in case of an alarm. | Trouble Log - Record What's Been Done to Correct Alarms: A Trouble Log window can be accessed for each alarm. NOC staff can record what corrective action has been taken, keeping clear documentation of what has been done. |
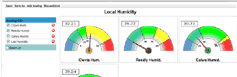 | 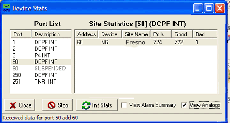 |
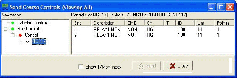
| Analog Values - View Analog Values In Their Native Units: In T/Mon's Web 2.0 interface (accessible from any PC on your network with a web browser), includes animated analog gauges for a quick visual reference that indicates whether the analog value is in range, out of range, or critically out of range. If an analog value is out of range, a flashing indicator on the gauge alerts you. Different gauge styles may be customized for each analog. | Device Status - Display Polling and Control Network Elements: The Device Status screen shows all the alarm elements on a given polling leg along with their current status. This screen may also be used to take devices on/off line and access device specific function. |