How to Use SNMP Get Requests for Analogs
By Morgana Siggins
October 26, 2020
When an SNMP manager wants to check on the status of managed devices it sends an SNMP Get Request to retrieve individual Management Information Base (MIB) values. The managed devices will then send back information to answer the Get Request message.
If, in your remote sites, you have analog points you need to monitor, then being able to successfully know how to use your master station to capture your analogs through Get Requests is very important. This guarantees monitoring efficiency and you can have complete visibility over your analogs.
That's why if you have our T/Mon master station, we want to make sure you know how to set up your Get Requests. In this article, we'll go over the step-by-step on how you can use SNMP Get Requests to capture analogs in the T/Mon.
Find the Analog you Want to Capture
First of all, make sure you know which analogs you want to capture. You can to this by opening the MIBs from the manufacturer in a MIB browser. We recommend the iReasoning free MIB browser - you can download it here http://ireasoning.com/mibbrowser.shtml.
Now that you know the OID and name of the analog you want to capture, you can continue. As an example, we will be using the AVTECH Room Alert. The Room Alerts internal temperature in Fahrenheit can be captured using the OID ".1.3.6.1.4.1.20916.1.8.1.1.1.1.0", which is found in the MIB.
Add the Analog to the Blueprint
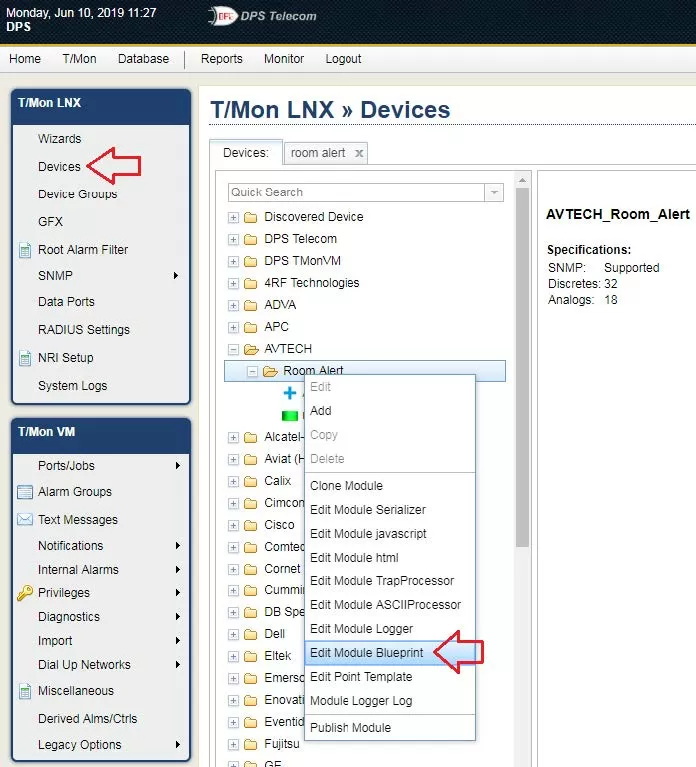
- From the edit menu, select Devices, and find your device.
- Right-click on the device and select "Edit Module Blueprint"
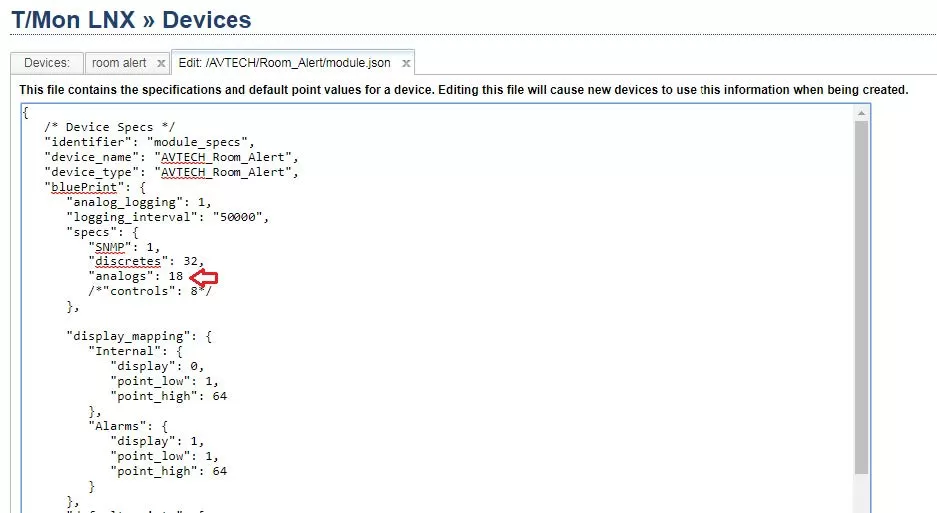
- Make sure that you have some number of analogs set in the blueprint
- Usually, you'll want to add analogs after the alarms.
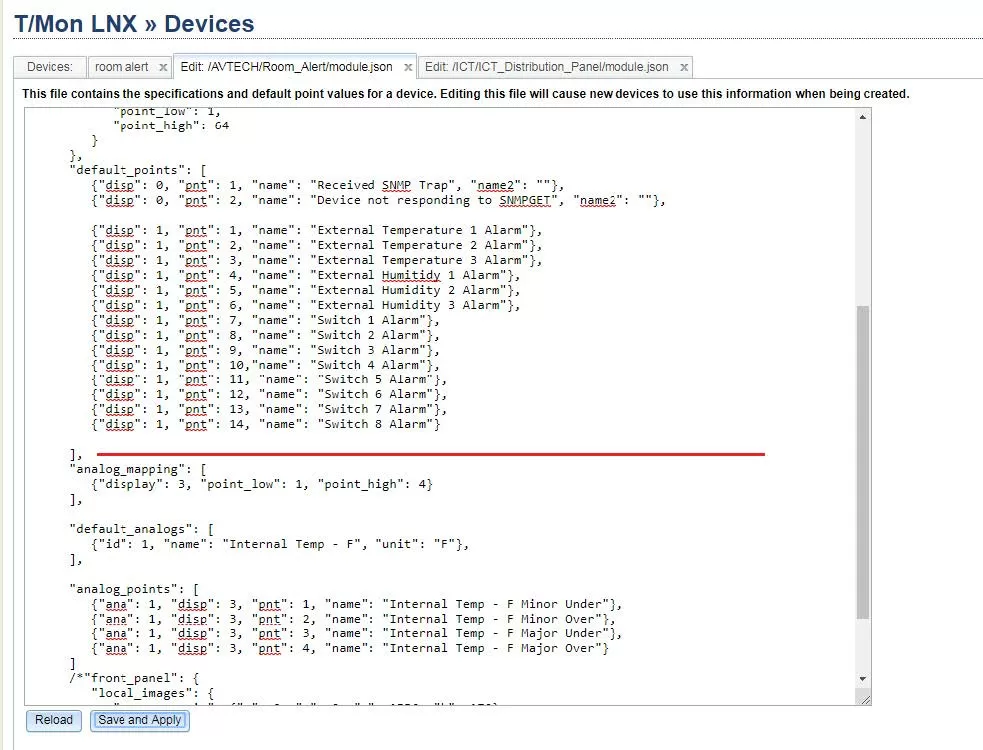
- There are three pieces to analogs: analog mapping, the default analogs, and the analog points.
- Analog mapping is how the analogs are mapped in the display.point fashion, as well as how many points to use for each analog (typically only 4 for major/minor over/under).
- The default analogs are the names, unit, and any other options that the analogs will have by default.
- The analog points are for where each major/minor over/under is located.
- The curly braces ({ }) and square brackets ([ ]) are imporant, as weel as the spelling and cases of "display", "ana", "name": and everything else to the left of the color (":").
- For "name", the text in the double quotes ("") can be whatever you want the point to be named
- The commas and ordering of braces and brackets is very important
- Once you've changed the blueprint, click "Save and Apply" at the bottom. You should see a a "Save Successfully" at the top in green.
- If you get a red "JSON is Malformed", that means there is an issue with your syntax.
- Look through the Troubleshooting Checklist at the end for things to check.
- If you refresh your browser, you should see a new tab with your analogs
- If you refresh and you are stuck on a perpetual loading screen, see the Troubleshooting Checklist below for tips.
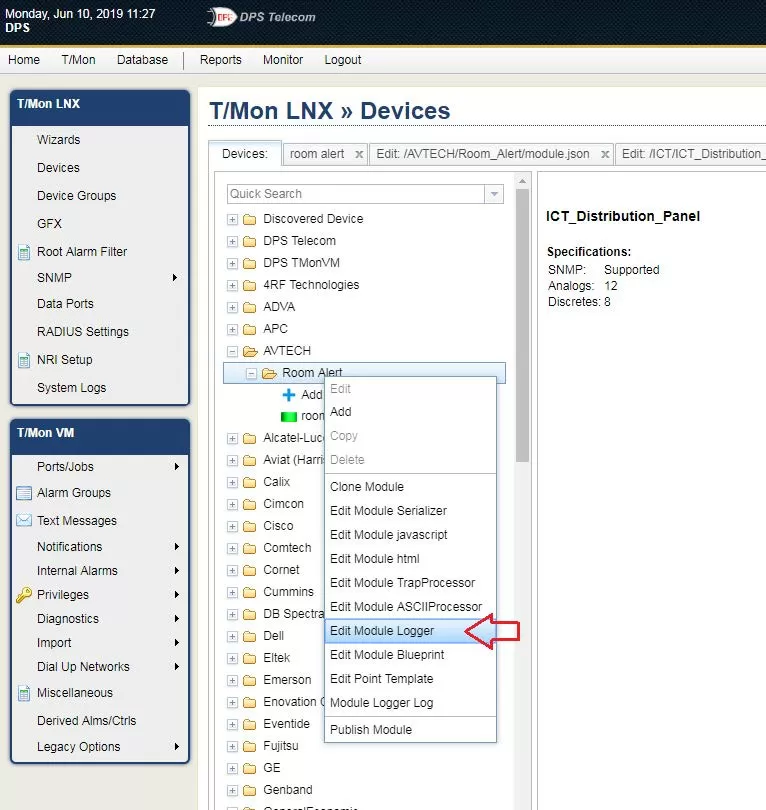
Edit Module Logger
The module logger is a script that will that will run at defined intervals. It's in here that you will define which OIDs will be used in the Get Requests.
- From the "Devices" menu, right-click on your device, and select "Edit Module Logger"
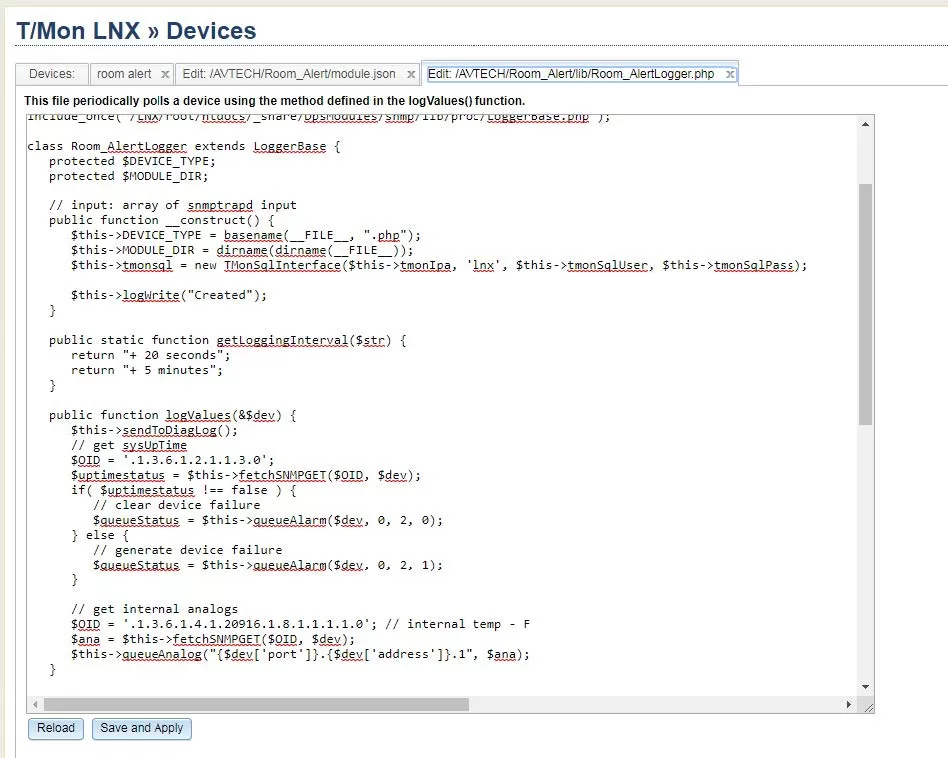
- In here, there are 2 functions of note: getLoggingInterval, and logValues
- getLoggingInterval is how you set the regular interval that the logger will run. Usually, 20 seconds is the lowest you'll want to go, and the max can be whatever you think is appropriate.
- The plus is necessary, and you can use the word with or without the plural
- logValues is the function that gets called at that regular interval. This is where you'll set the OIDs that will get the analog values.
- While testing, you should set getLoggingInterval to 20 seconds, which you can do so by removing the "//" in the function.
- This will make the logger run more frequently and you can see any changes you add
- In the logValues function, you should first add $this->sendToDiagLog(); at the top of the function.
- This will create the logger file for the device
- The first part of the function does an uptime SNMP Get Request in order to a) verify that the device is there, and b) verify that it is responding the Get Requests
- After that, you can add your own Get Request.
- Once you have the analog done in the logger. Click "Save and Apply", you should be able to see a "Saved Successfully" come up. If not, refer to the "Troubleshooting Checklist" below.

Test the Analog
- Add the analog to a group or create a group to add it to.
- Verify that the values coming in are correct.
- If the value needs to be divided or multiplied by a number in order to be correct, you can do so in the Logger, or in the analogs tab.
- If done in the Logger, make sure to click the "Save and Apply" button. The new values should appear within the next minute.
Troubleshooting Checklist
JSON is malformed
This is due to an error in syntax. You can look at your recent changes and make sure the following is true:
- There is a comma after every closing curlt brace (}) except for the last on in a list.
- For every opening curly brace and square bracket there is a matching closing one.
- Every identifier (words in double-quotes to the left of the colon) is present, and there is a colon. Also, ensure there is a comma for after each pair.
- If you need to, you can also use a JSON validator. We usually use https://jsonlint.com/. You can copy and past your entire blueprint file and click validate JSON to see if there are any errors.
- Note that it will point out the comments, for example /*....*/. These are not in JSON typically, but our parser allows it. You'll have to remove them for the validator to find the actual error.
- Once it's all green, you can copy and paste it back into the T/Mon.
Error when saving Logger file
- Usually, it will tell you the error in the file, but it will reference a line number.
- You can count out the lines in T/Mon to find the right line number, or you can copy paste the file into a text editor with line numbers, such as Notepad ++.
- The errors can be obvious (missing a semicolon at the end of the line, or quote), or they can be harder to find (some errors will tell you a line number, but the actual error is farther up).
- You can try things like https://phpcodechecker.com/ to see if that can find your issue, as the file is just a php script (using PHP 5.6).
I keep getting device failures on my device
- Make sure that you have port 161 open to UDP.
- You can use the test button the system tab to make sure you can reach the device using SNMP GETs.
My analog values are not showing up
There can be various reasons why the analog values are not showing up.
- The first thing you should do is make sure there are no errors in your script. You can verify that by going to "System Logs" and then using the drop-down menu to find "php_err". This is a log that has all of the errors and warnings that appear in PHP. While you were able to save, there might still be an error in your script. If there is no php_err log then it most likely is a different issue. If there is one, check to see if your device is called it. The log could have a different error or warning in there.
- If you see "fatal_error" with regards to your device, that means that there is an error that is causing the script to completely stop. This may cause your analogs to not show up.
- If this is not causing you an issue, then you may need to add debug in your script and use the device log to find your issue.
- You can use $this->logWrite("your message here"); to add messages in the log to find where it is possibly breaking or having another issue.
After I added analogs to the blueprint, I couldn't edit my device
Most likely the device you cloned from didn't have the proper support for analogs. You can easily fix this with with a few lines and a refresh.
- If you right-click on your device and go to "Edit Module JavaScript", you'll see the JavaScript used to render the module tabs.
- Copy the following two lines
"dps/edit/tmon/modules/points/AnalogTab",
"dps/edit/tmon/modules/points/AnalogAlmTab",
and place them below the line
"dps/edit/tmon/modules/points/AlarmTab", - Copy the following two lines
AnalogTab,
AnalogAlmTab,
and paste them below the line
AlarmTab, - Save and apply your changes.
- Press ctrl+F5 or ctrl+shit+R to refresh your page without cache.
- Try editing your device now.
The Bottom Line
If you need assistance with the process of using SNMP Get Requests to capture analogs in T/Mon, or you need to troubleshoot any issues you might be experiencing, just contact our tech support.
We aim to provide excellent, personalized tech support to our clients. There's no voicemail, you don't have to navigate menus, instead, you get to talk to a real person. In fact, every support tech is an experienced engineer that will help you diagnose and fix any issues. So, if at any point you experience any kind of problem, simply give us a call.
Morgana Siggins
Morgana Siggins is a marketing writer, content creator, and documentation specialist at DPS Telecom. She has created over 200 blog articles and videos sharing her years of experience in the remote monitoring industry.