Check out our White Paper Series!
A complete library of helpful advice and survival guides for every aspect of system monitoring and control.
1-800-693-0351
Have a specific question? Ask our team of expert engineers and get a specific answer!
Sign up for the next DPS Factory Training!
Whether you're new to our equipment or you've used it for years, DPS factory training is the best way to get more from your monitoring.
Reserve Your Seat TodayDPS equipment is designed to be powerful, robust, and reliable. We want to help you minimize the amount of time you spend visiting your site to fix or check on things, so you can focus on what's more important to your business. Even for the most experienced of us, things don't always go as we would like. Sometimes our configuration doesn't send out SNMP traps correctly, or our our email notifications don't make it to their destination. When things like this happen, us engineers at DPS use one of the great tools provided in our equipment to troubleshoot it: The Debug Menu.
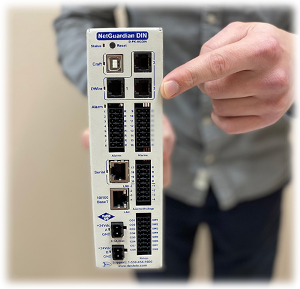
On almost every unit, you will have access to a debug window to help troubleshoot what the unit is doing and where the problems may be occuring.
To access the debug menu, you have a couple options. You can use the craft port on the front of the unit, or you can use telnet. To connect via craft, use the DB9 to USB cable, and use a terminal program like PuTTY to connect on the COM port. Most units will use 9600 baud (a handful of units use 115200, you can check the User Manual for your unit to find it's baud rate). You may need to install drivers for the USB cable.
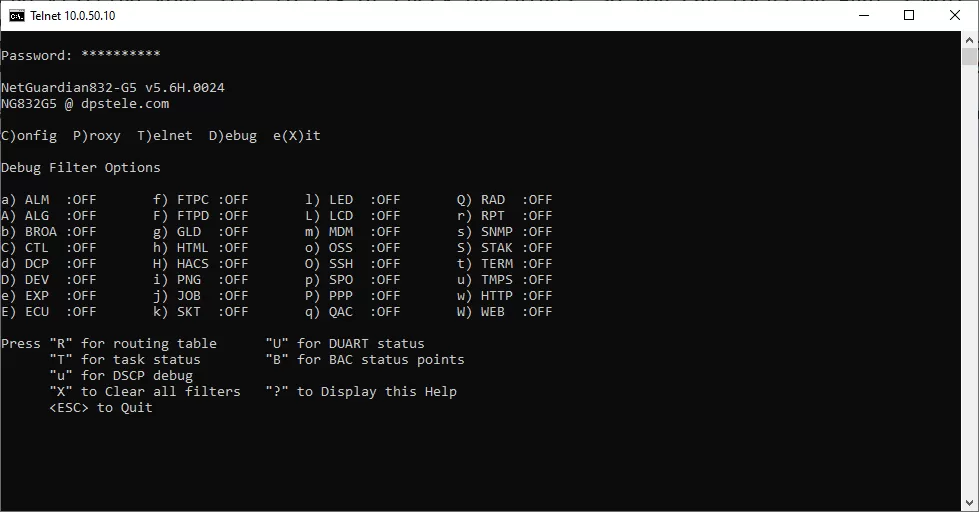
To connect via telnet, open command prompt (or terminal on linux/mac) and type "telnet [YOUR_IP_HERE] 2002". This connects you to the telnet server on the unit. From here you have the same interface as the craft port. If you receive an error, you may need to install the Telnet Client on your computer.
To open the debug window, log into your unit and press D when the menu options appear. The options can be toggled on/off by entering the letter of associated with the debug option. These may vary from unit to unit (for example, 'S' may be SNMP on one unit, while 'q' may toggle it for a different one.).
First up is the alarm point debug (ALM). This option shows each of the alarm banks, and puts out a '.' if the alarm is clear, and a '1' if it is active. In the example below, alarm point #1 is in alarm, everything else is clear.

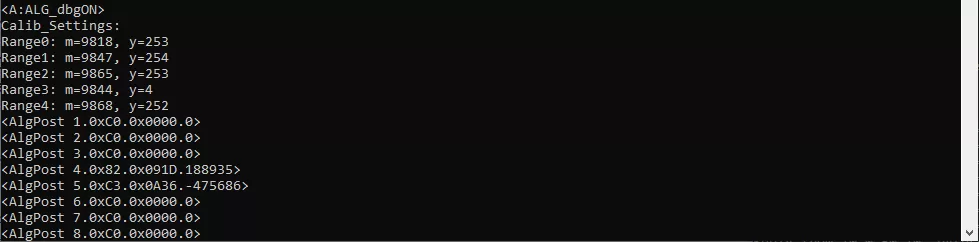
Next is the analog debug (ALG). This option shows each of the detected analogs and sensor values. The value at the end of each line is an integer representation of the analog value. Divide this number by 10,000 to get a decimal value. The values shown in the example below are the input voltages (-475686 = -47.57 VDC) and the raw voltage value of the internal temperature sensor (188935 = 18.89 VDC).
Control debug (CTL) is the third one. This option will show you the processing of your derived controls. In the example below, the debug is showing output for processing the derived control "_OR D1.1".
Next we have DCP debug. This will show if your device is receiving DCP protocol communication. It outputs the packet data, and where the packet is coming from. This is useful for debugging communication with a master station such as T/Mon, for example. [AA][FC] means a packet that was a command, and [AA][FA] means a packet that was sent as a response. Most often the important piece of data from this is the IP address, as it tells you what IP address is trying to talk to it.

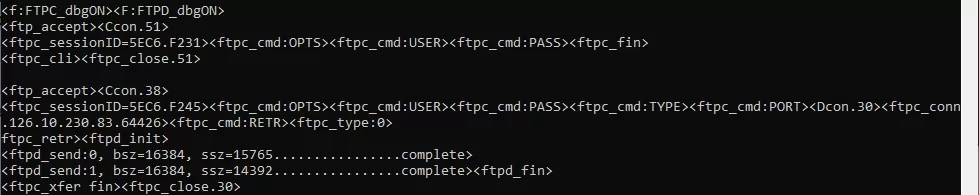
FTPC and FTPD are two debug options related to FTP command, and FTP data, respectively. Enabling these options will print out information about your FTP connection. FTPC will output the commands the unit is receiving from outside, and FTPD will show the transfer data sizes and information. In the example screenshot below, I downloaded the config from a unit using FTP. The first section was an unsuccessful login (wrong user/password combination), and the second section was a successful login and download of the NetGuardian's configuration file. ftp_accept and ftp_close mark the start and end of the connection.
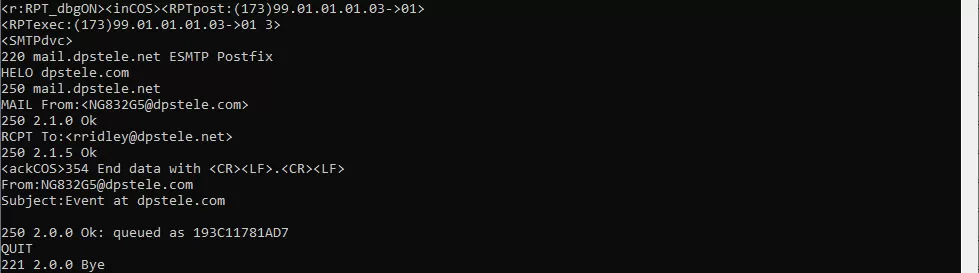
RPT is used for checking reporting outside of the NetGuardian. (For example, emails or notifications to a server). This can be useful to verify if your notifications are configured correctly. Here we see an email notification that was successfully sent to my email. The screenshot shows the conversation between the email server and the NetGuardian.
SNMP is a very useful debug option, this shows traps sent and recieved from the unit, which is very convienent when working with SNMP devices. This lets you see exactly what trap OIDs have been received from outside of the unit. Some units have different functionality with this debug option. Some will print out data on traps recieved, while others will only print sent trap data.

Due to the large number of debug options, I've only covered a few of the most commonly used debug options in this article. If you'd like to learn more or are having issues with anything not covered here, please give us a call! We'll be happy to help you learn the equipment and resolve any issues you are having with it.

Ryan Ridley
Ryan Ridley is an Electronics Test Technician at DPS Telecom. He has worked in tech support, engineering and manufacturing. He brings over 6 years of experience working with DPS hardware and software. At DPS Telecom, Ryan is responsible for performing testing on our products to verify they work ...