Check out our White Paper Series!
A complete library of helpful advice and survival guides for every aspect of system monitoring and control.
1-800-693-0351
Have a specific question? Ask our team of expert engineers and get a specific answer!
Sign up for the next DPS Factory Training!
Whether you're new to our equipment or you've used it for years, DPS factory training is the best way to get more from your monitoring.
Reserve Your Seat Today(Video demo contains no sound)
Do you need access to historical analog sensor trends to answer questions like:
What you need is a fast, convenient way to generate a graph of your analog sensor history.
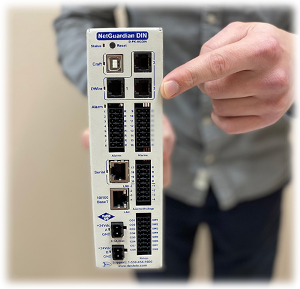
That's why DPS has released a new web-based trending tool for its NetGuardian RTUs. The new feature is located on the unit's web browser interface and allows you to build a customized trending graph based on sensor measurements taken over specified time intervals.
The new Adobe flash-based graphing tool gives you an intuitive way to construct graphs and view past sensor measurements.
With this new feature, you can chart the history of your sensors and discover past environmental trends in order to anticipate future conditions. Building a personalized graph gives you a better understanding of network conditions. With this new graphing feature, you'll be able to answer difficult questions about long-term HVAC effectiveness, humidity fluctuations, etc.
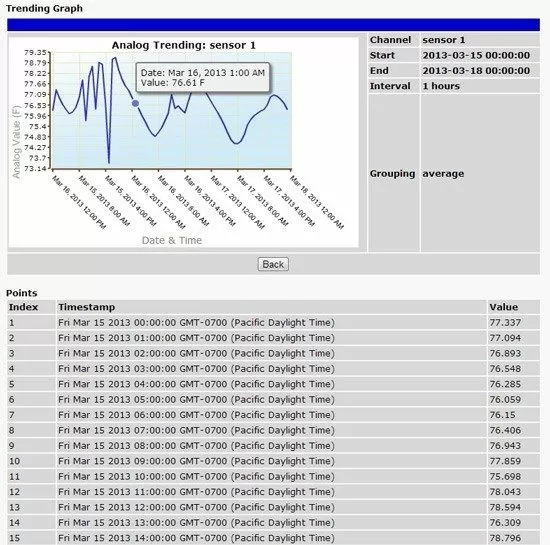
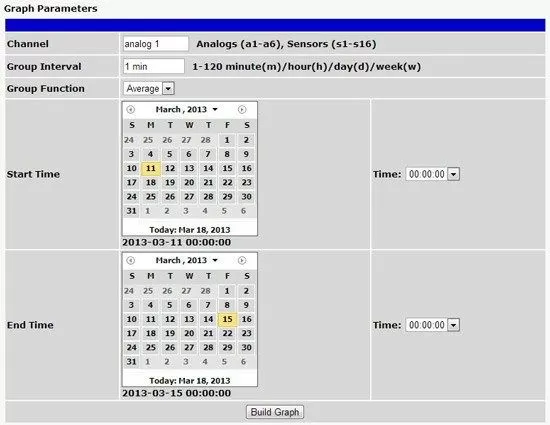
You'll access trending in the NetGuardian web interface by typing the unit's IP address in your web browser address bar. In the graph parameters section, you're given the option to specify which sensors to measure, the interval of measurement (minutes, hours, days, or weeks), and the group function (average, minimum, or maximum) of all the recorded measurements. Once these parameters are combined with the desired start time, end time, and time of day, you simply click "Build" and the browser instantly creates a graphical display of all past measurements complete with a detailed list of every indexed point.
As you move your cursor over the graph line, you'll be able to see the detailed information (date, time, and value) for each specific data point.
We spoke with Sergey Dub, DPS Director of Engineering to get a better feel for the idea behind the graphical interface. "The new trending tool in the NetGuardian web interface is fast, and all of the sensor history is stored in the NetGuardian's non-volatile memory," he explained.
"You get a lot of options to specify the graph most suited to your needs. And once the graph is created, you can easily mouse over any point on the graph to quickly view the date, time, and value of each measurement. The interface provides a text list of all registered alarm points and can quickly be adjusted to view any timeframe you want."
DPS Telecom developed the graphing function to let you build a graph based on all of your measured information. Combined with the existing web interface of DPS' NetGuardian RTUs, this feature gives you unprecedented ease of access for organizing all of your alarm monitoring data.
The new RTU graphing feature has been designed into the NetGuardian Voice 16 RTU. If you are interested in this feature for any NetGuardian RTU (including firmware upgrades for existing RTUs), call
1-800-693-0351 for more information.
To get more information, an upgrade discount price quote or ROI analysis...
Call 1-800-693-0351